The analysis compares both concentration and average valuation rather than relying on company counts alone.
Public project | Python and Power BI
Analyzing Startup Success
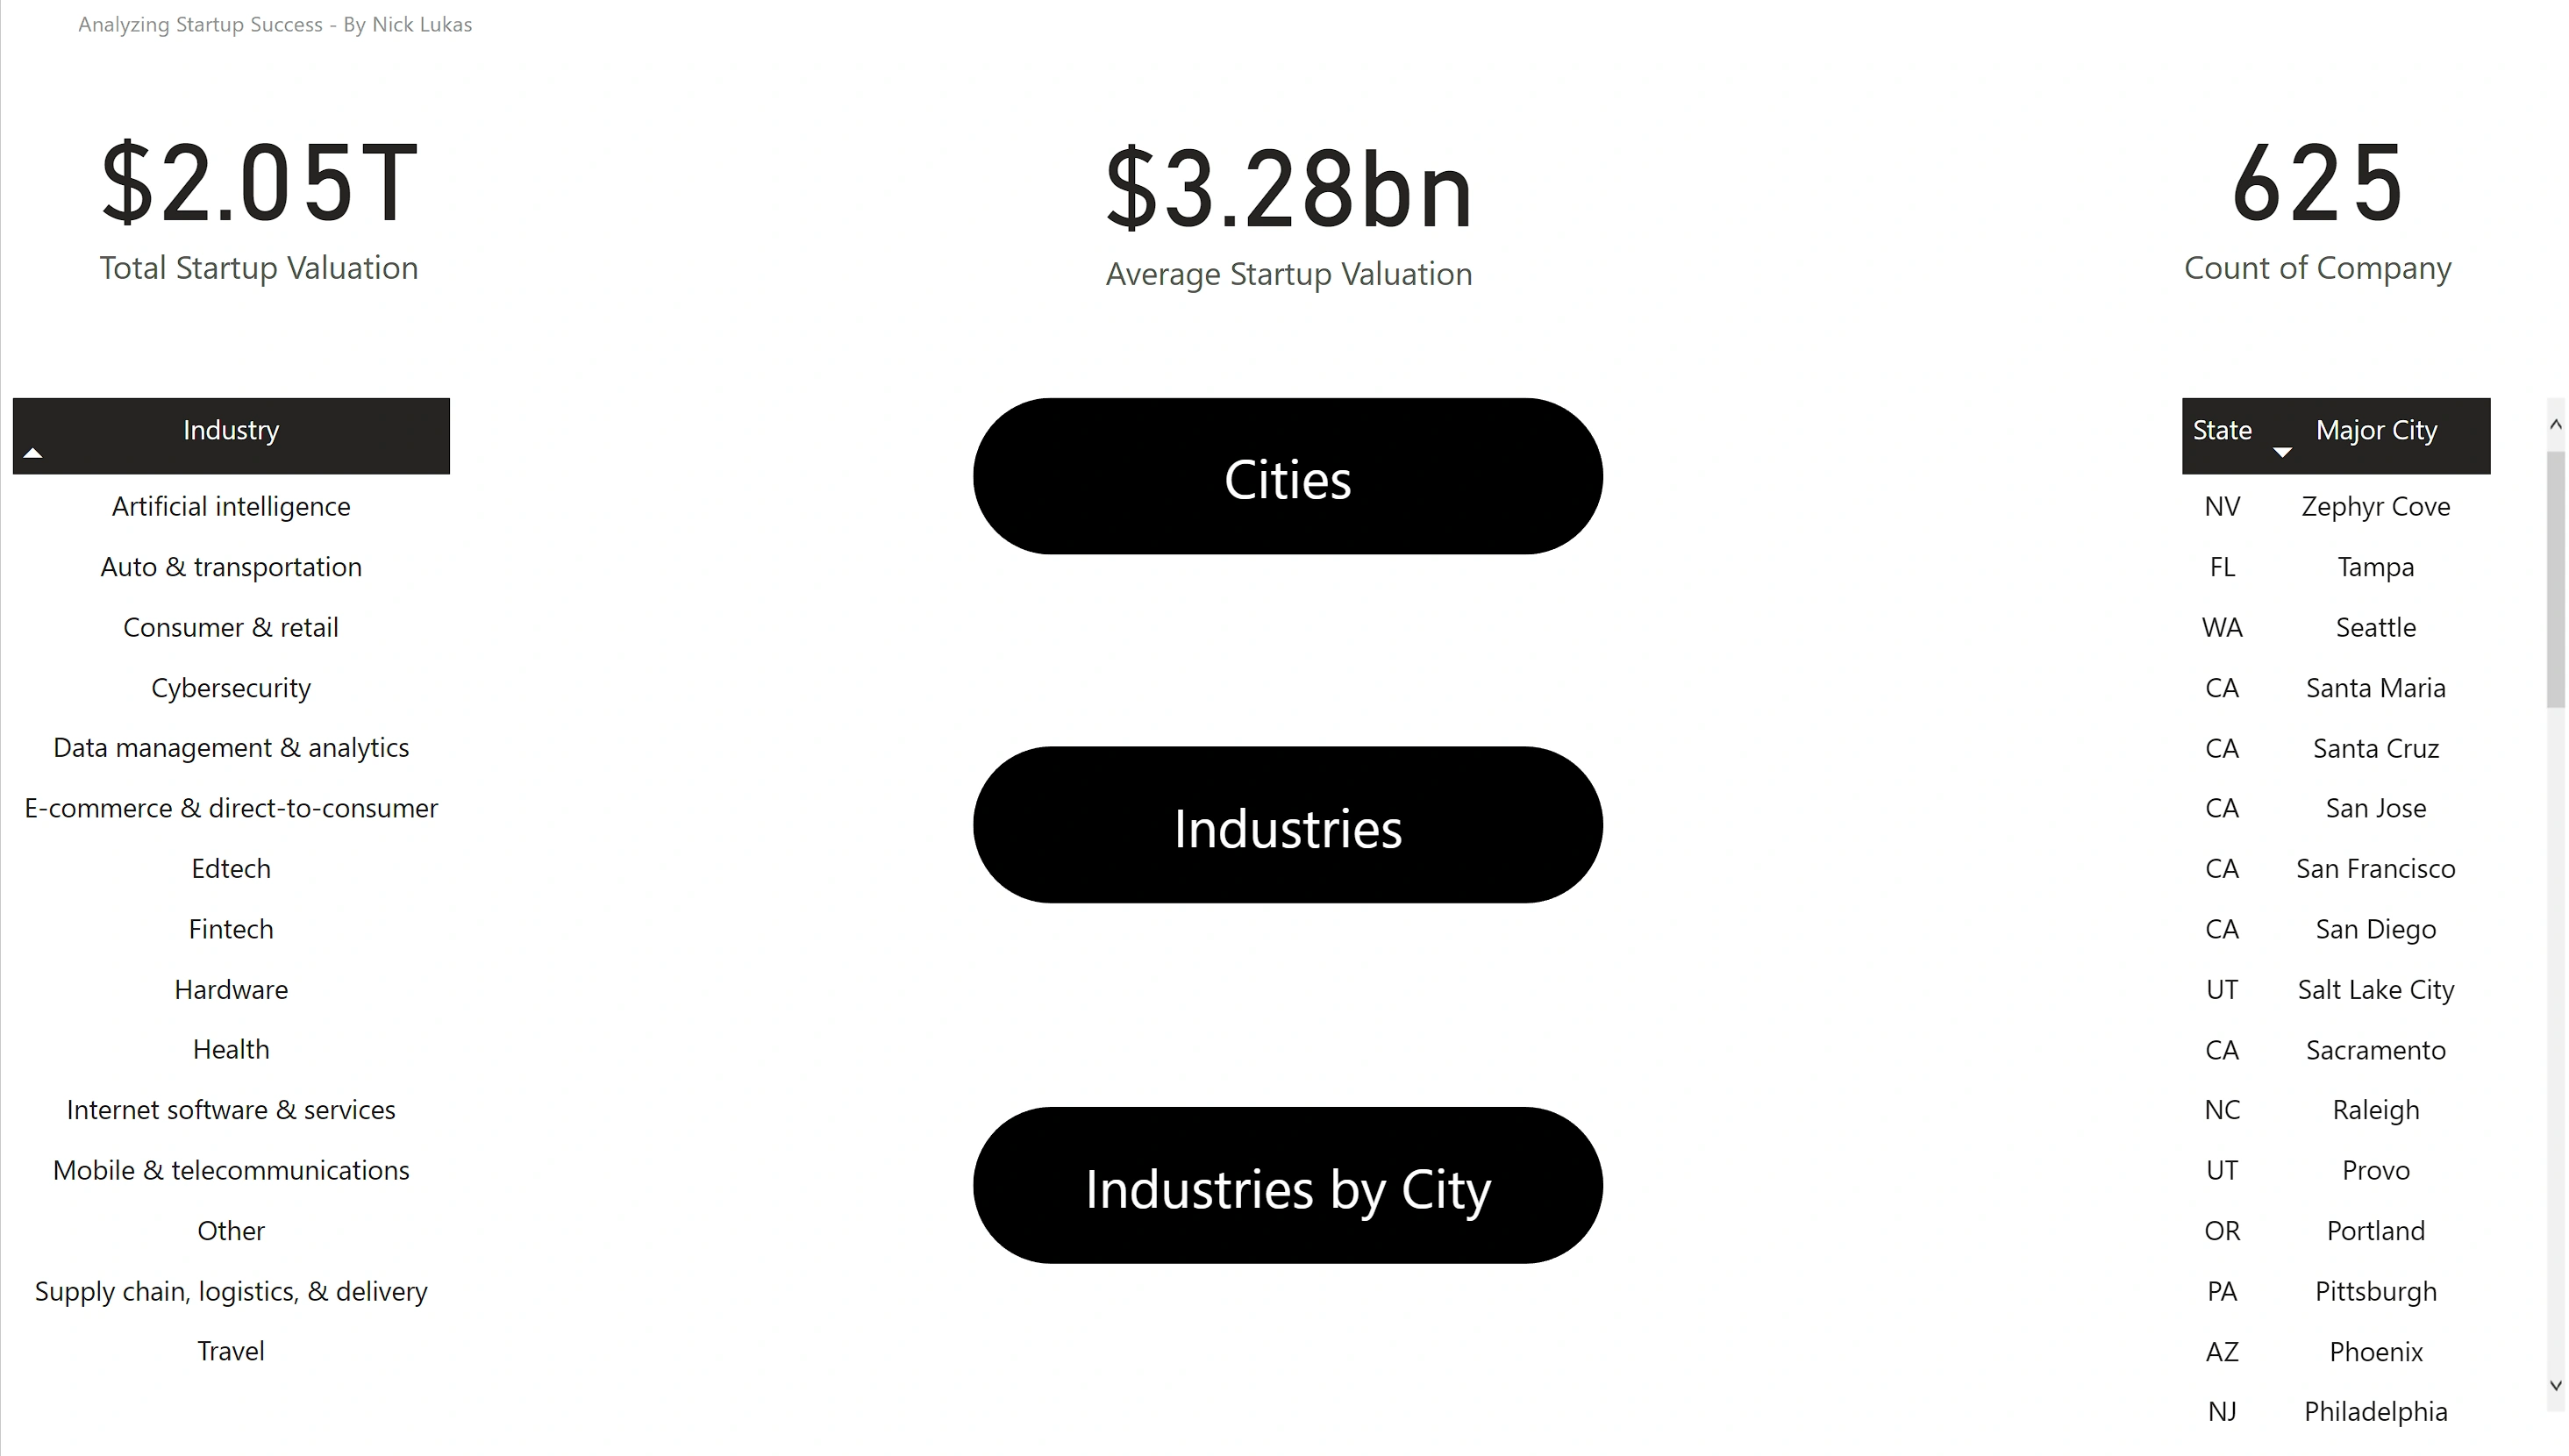
An end-to-end analysis of unicorn startups that uses Python to collect and structure data, Power BI to model and visualize it, and valuation-based metrics to compare outcomes across cities and industries.
Requests, Beautiful Soup, pandas, relationships, and DAX create the analytical model.
Dashboard, map, treemap, matrix, and drill-down views provide multiple levels of detail.
Executive summary
What drives unicorn concentration and valuation?
The project analyzes private companies valued above $1 billion. Success is defined as average startup valuation within a city or industry, calculated as total valuation divided by the number of companies in that segment. The source data reflects the dataset available when the project was created and should be read as a historical analysis.
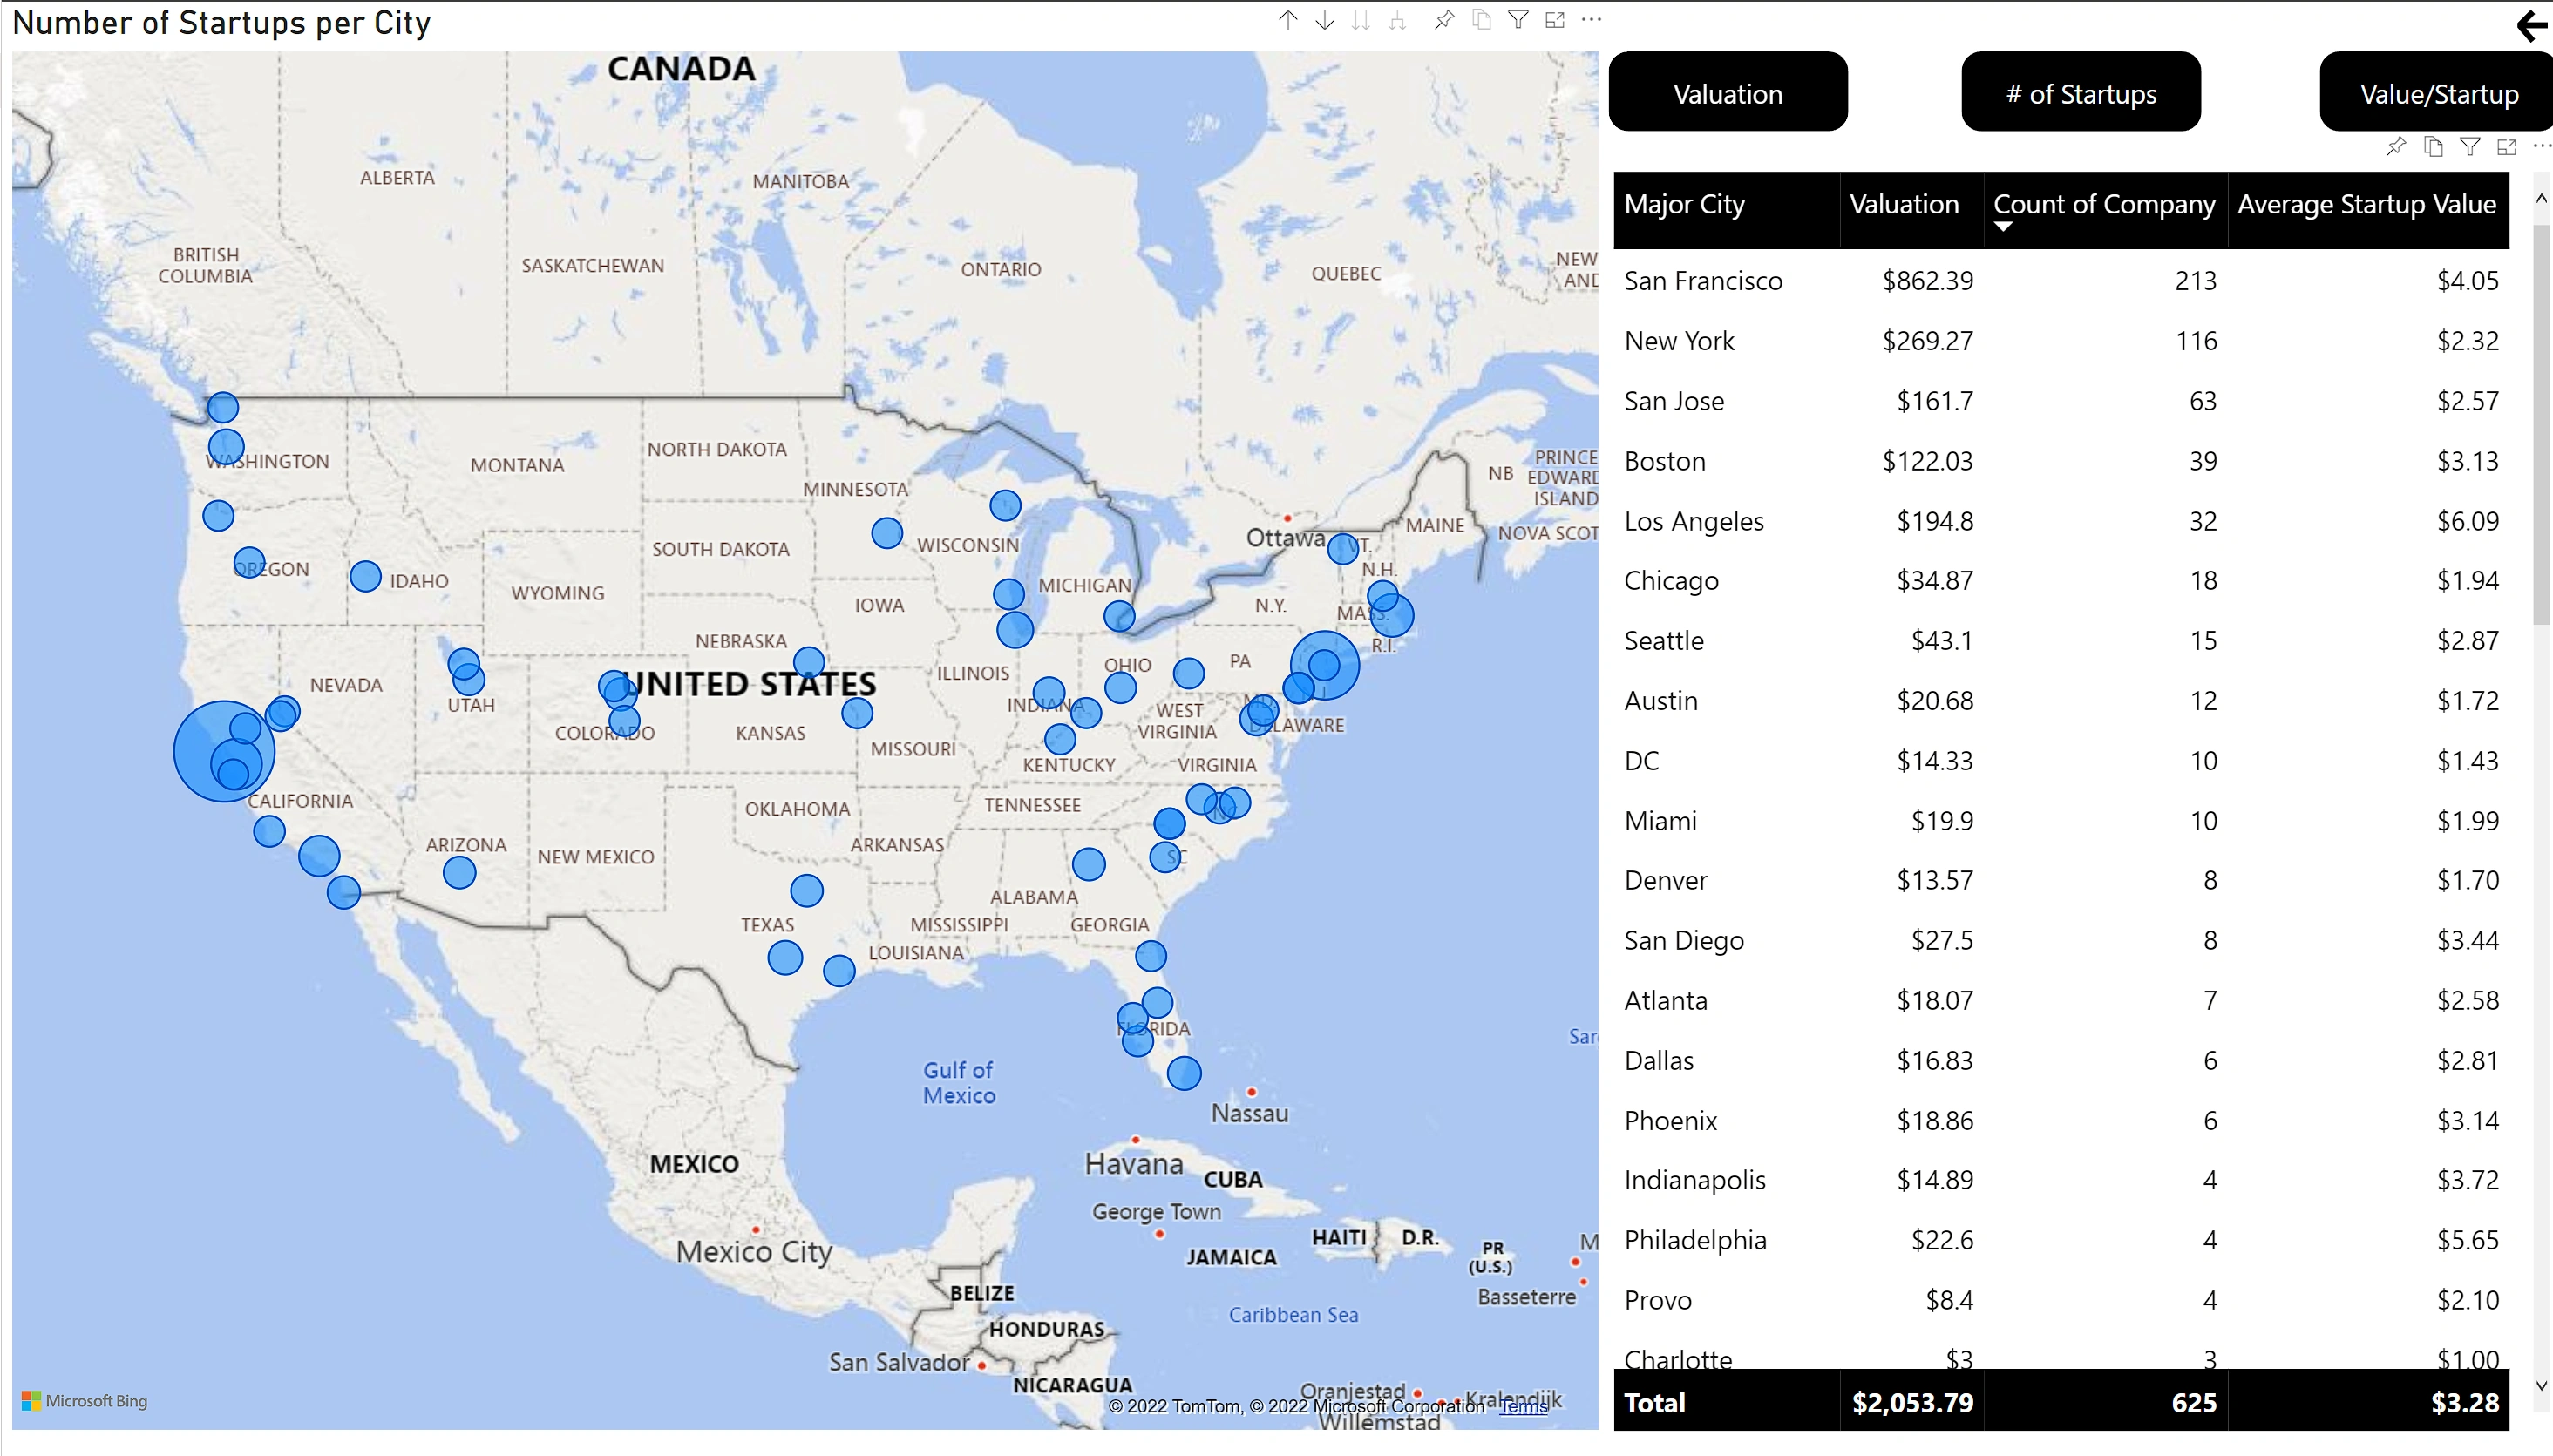
San Francisco had the most startups, followed by New York and San Jose. It had roughly twice New York's startup count but about four times its total valuation. Los Angeles produced a higher average valuation than both cities.
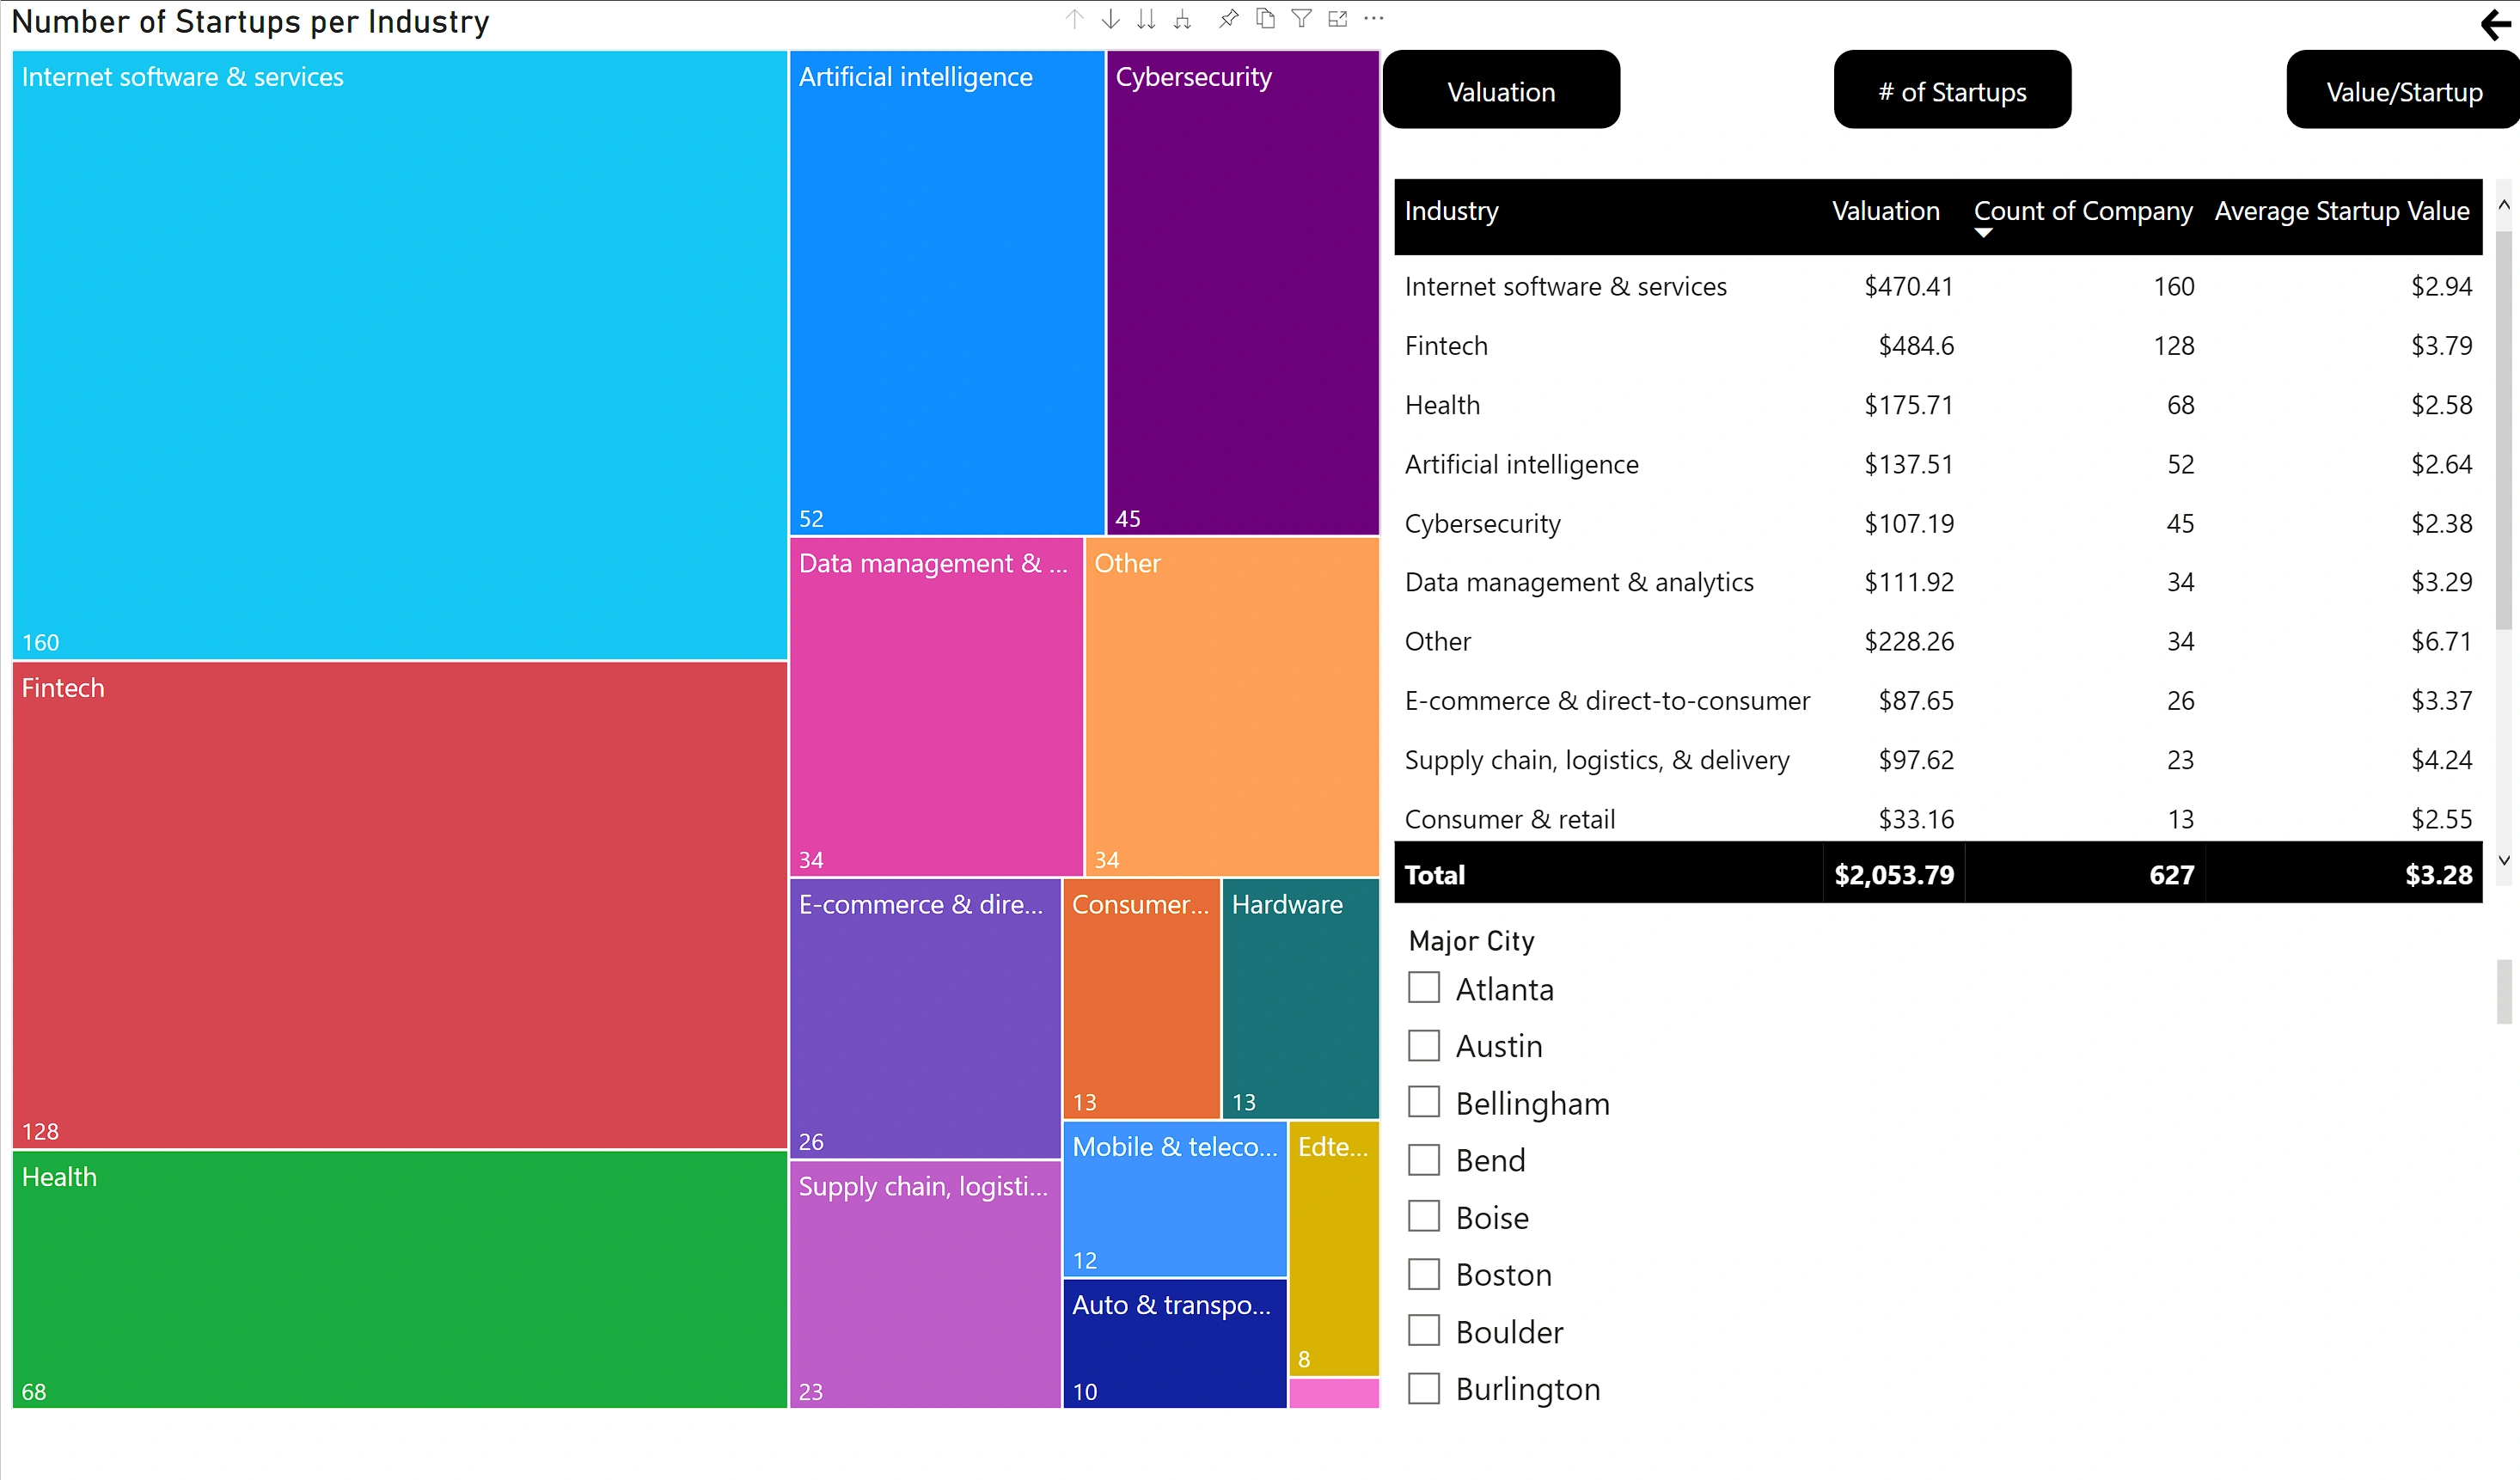
Internet Software & Services and Fintech led company count and total valuation. Travel led average value per startup, although that category contained only one company in the dataset.
The report identified stronger cybersecurity outcomes in Boston, Minneapolis, and San Jose; stronger e-commerce outcomes in Jacksonville, Boston, and San Francisco; and stronger health outcomes in San Diego, Dallas, and Chicago.
Research questions
- What cities produced the highest number of unicorns?
- What cities were the most successful for startups?
- What industries produced the highest number of unicorns?
- What industries were the most successful for startups?
- Did certain industries perform better in certain cities?
Initial hypothesis and success definition
The initial hypothesis expected San Francisco and New York to lead both startup count and average success, with technology-related industries performing best. Success was defined using average startup valuation, not simply the number of companies or total valuation.
Python data collection
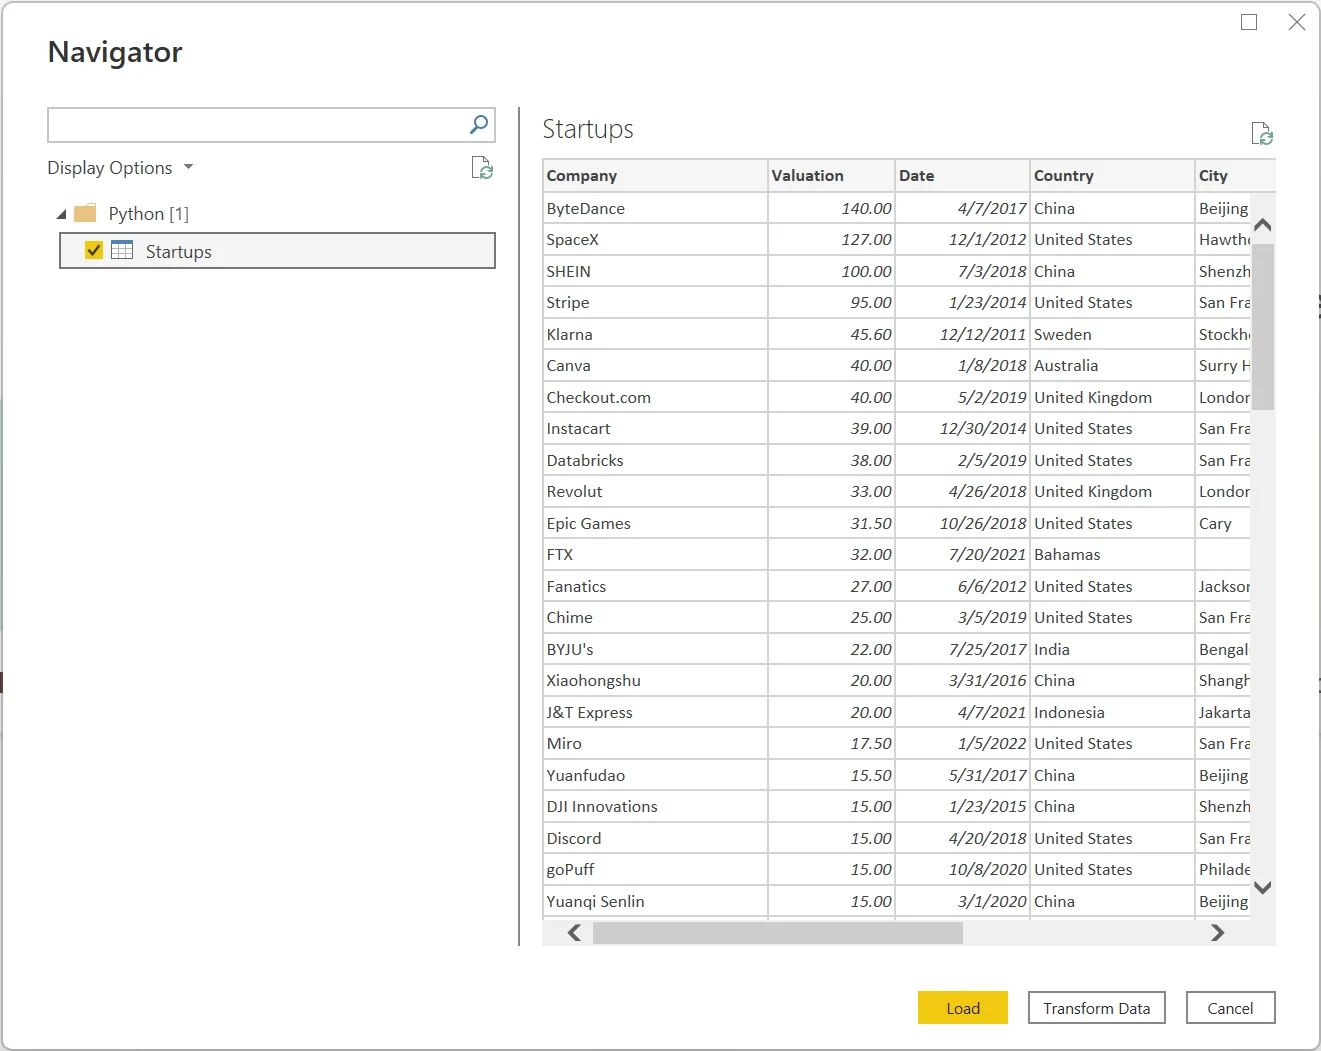
Python queried the source table directly into Power BI using requests and Beautiful Soup, then converted company, valuation, date, country, city, and industry fields into a pandas DataFrame.
requests + BeautifulSoup -> pandas DataFrame -> Power BIData transformation and DAX
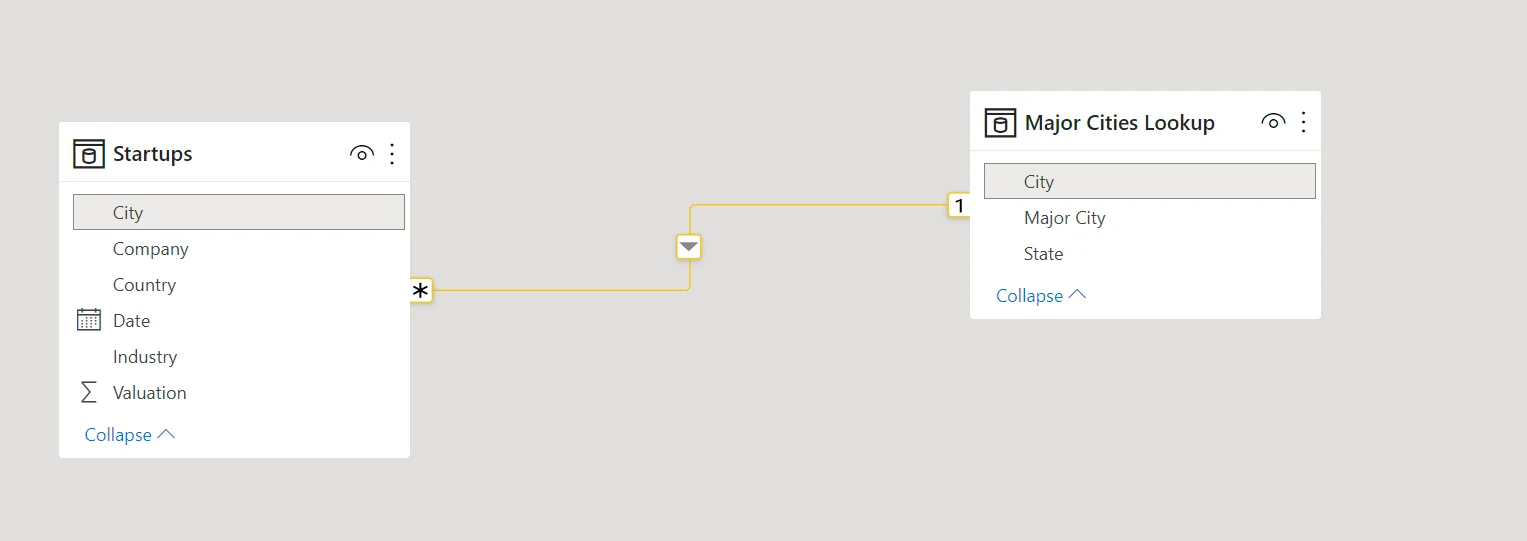
US startup locations were mapped to their nearest major metropolitan or micropolitan area using 2021 US Census data. A related lookup table supported a normalized major-city field, while DAX calculated average startup value across city and industry filters.
Average Startup Value =
DIVIDE(SUM(Startups[Valuation]), COUNTA(Startups[Company]))
Power BI report design
The report includes a high-level dashboard, city map and table, industry treemap and table, clustered bars by city and industry, a matrix of average valuation, cross-filtering, drill-downs, and selection-based detail views.
Detailed findings
- San Francisco led startup count, followed by New York and San Jose. San Francisco had roughly twice New York's startup count and about four times its total valuation.
- Los Angeles averaged approximately $6.09B per startup, compared with approximately $4.05B for San Francisco and $2.32B for New York. In the historical dataset, San Francisco ranked eighth and New York ranked twenty-seventh by average startup value.
- Internet Software & Services included 160 startups with approximately $470B of total valuation, but averaged approximately $2.94B per startup.
- Fintech included 128 startups with approximately $484.6B of total valuation and approximately $3.79B average value per startup.
- Travel had the highest average value at approximately $7.25B, although that result was based on one company in the category.
- Supply Chain, Logistics & Delivery averaged approximately $4.24B per startup across 23 companies.
- Cybersecurity performed most strongly in Boston, Minneapolis, and San Jose; e-commerce in Jacksonville, Boston, and San Francisco; and health in San Diego, Dallas, and Chicago.
- The results did not support the initial assumption that New York and San Francisco would also have the highest average startup valuations or that technology categories would always lead average value.
Conclusion
The project concluded that the locations with the most unicorns are not automatically the locations with the highest average company value. It also found that industry and city interact, so location decisions should consider the specific industry rather than relying only on overall startup concentration.
Interactive report
Explore the live Power BI dashboard
Use the report controls to filter the analysis by geography, industry, and underlying startup results.
Report gallery
Dashboard, analysis views, and data preparation